
Suzuyo in Figures
Here is an introduction to Suzuyo in numbers related to history, group companies, hubs/locations, facilities and human resource information.
Company information
-
-
History
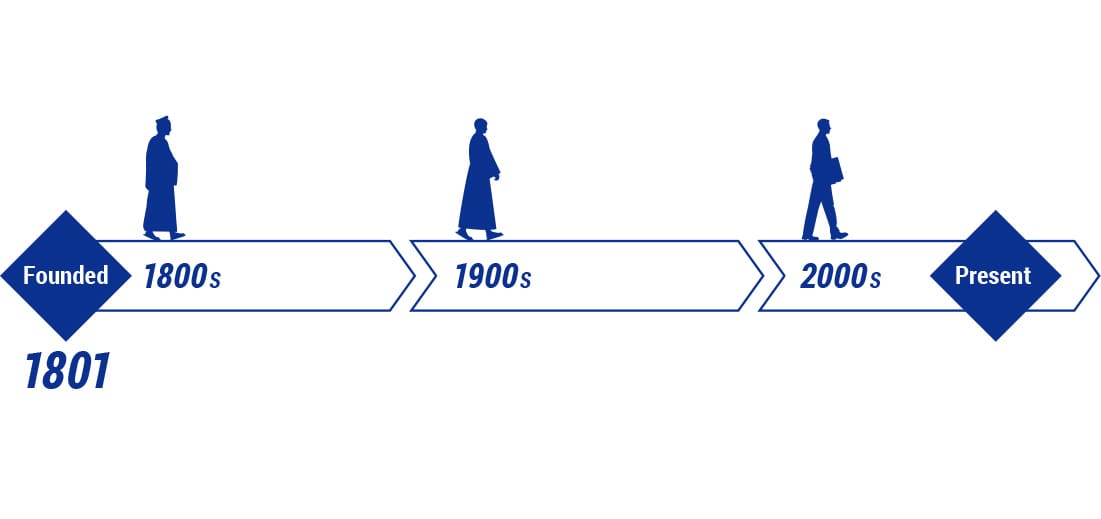
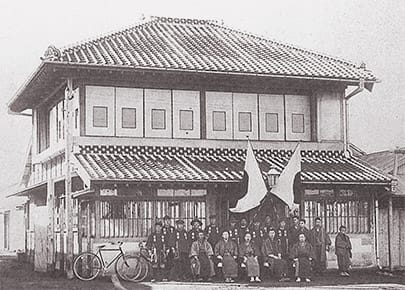
Founded in
1801
First founded over 200 years ago as a domestic shipping wholesaler in the port of Shimizu.
-
-
Sales

JPY171.0billion
As of August 2025
-
Employees

1,168
As of August 2025
-
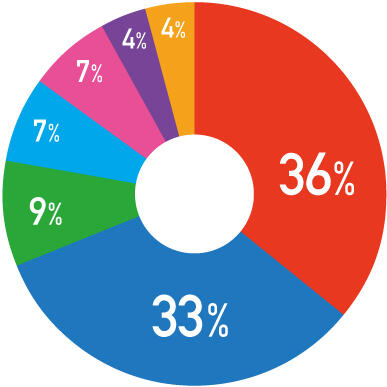
Suzuyo Group consolidated sales
-
-
Sales
JPY591.0billion
-
Employees
13,600
As of August 2025
-
-
-
Locations
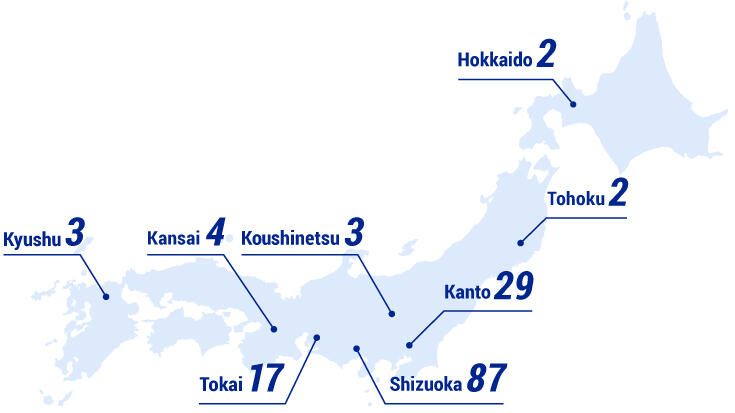
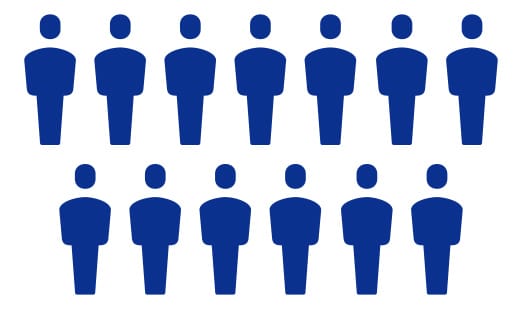
Domestic locations
147locations
A Premium Top-class network among Japanese logistic business enterprises has been developed throughout Japan from Hokkaido to Kyushu
-
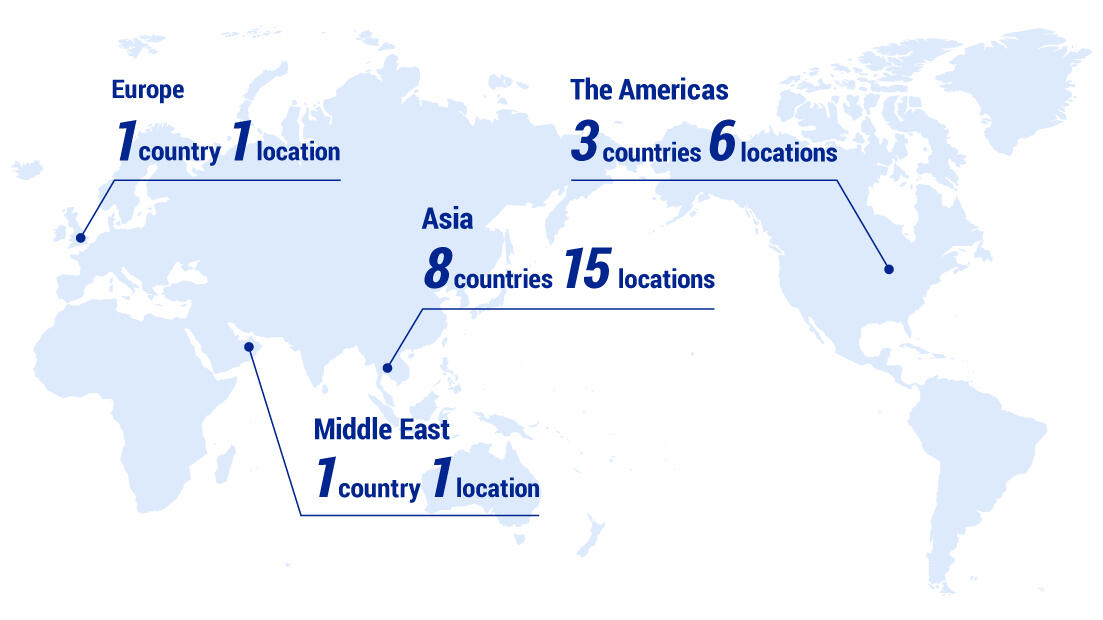
International locations
23locations in13countries
Covering over 200 countries/areas globally under a strategic alliance with UPS
We have our own entities in rapidly developing Asia, the USA where UPS is based, and Mexico where the automotive business is booming.
As of August 2025
-
Business / Services
-
Warehouse area

1,004,000m2
We have warehouse space equivalent to 20 Tokyo Domes throughout Japan.
As of August 2025
-
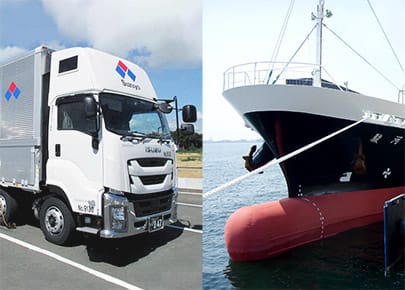
Owned trucks

2,893units
We offer a diverse range of transportation services using various types of vehicles including trailers, large-size vehicles and 4-ton trucks, etc.
As of August 2025
-
Our logistic specialists

Licensed customs
brokers269
Licensed logistic
technical managers25
Our specialists in export/import & logistics provide optimal proposals to solve problems for customers.
As of August 2025
-
IT specialist

1,000
Our IT specialists including those of our group companies support customers to resolve issues and overcome challenges.
As of August 2025
Employee information
At Suzuyo, we consider working to further improve employee engagement, hiring diverse human resources and respecting human rights as an important factor.
As a part of engagement improvement, we are working with the provision to create a friendly workplace environment, to uphold the maintenance of institutional systems and to invest in human resource education and development with the goal to realize employee 'Well-Being' and better job satisfaction. In addition to this we are also working to promote the development of various systems that can support the balancing of work and parenting/childcare and the employment of diverse human resources.
-
Average number of
paid leave days taken per year
13.6days/year
As of August 2025
-
Average years of service

15.3years
As of August 2025
-
Average seminar time
per person a year
10.1hours/year
As of August 2025
-
Voluntary turnover

2.0%
As of August 2025
Employee status
| 2023 | 2024 | 2025 | ||
|---|---|---|---|---|
| Number of employees | Total | 1,138 | 1,146 | 1,168 |
| Male | 913 | 916 | 929 | |
| Female | 225 | 230 | 239 | |
| Average age of employees (years) | 39.5 | 39.7 | 39.8 | |
| Number of new hires | 58 | 54 | 56 | |
| Number of new graduate hires | 35 | 38 | 33 | |
| Number of mid-career hires | 23 | 16 | 23 | |
| Mid-career hires (%) | 39.7 | 29.6 | 41.1 | |
| Overall turnover (%) | 5.2 | 4.9 | 3.4 | |
| Voluntary turnover (%) | 3.7 | 3.3 | 2.0 | |
Environment
Unit: t-CO₂
| 2023 | 2024 | 2025 | ||
|---|---|---|---|---|
| Scope 1 (Direct emissions) | 6,360 | 6,760 | 7,171 | |
| Scope 2 (Indirect emissions *1) | Market standard | 14,942 | 16,748 | 13,466 |
| Scope 1+2 | 21,302 | 23,508 | 20,637 | |
| Scope 3 *2 | Category 1 (Purchased goods and services) *3 | 56,857 | 296,965 | 219,524 |
| Category 3 (Fuel- and energy-related activities) | - | 3,434 | 3,605 | |
| Category 6 (Business travel) *4 | - | 124 | 138 | |
| Category 7 (Employee commuting) *4 | - | 280 | 314 | |
| Scope 1+2+3 | 78,159 | 324,311 | 244,218 | |
*1 The scope of sites for electricity consumption calculation was reviewed in FY2024, resulting in an increase of 28 sites.
*2 Categories 3, 6 and 7 have been newly added to the calculation from FY2024.
*3 Emissions from transportation services purchased from Suzuyo Cargo Net Co., Ltd. and Suzuyo Auto Transportation Co., Ltd.
*4 Emissions calculated based on the number of full-time equivalent (FTE) employees.
Diversity of employee
| 2023 | 2024 | 2025 | |
|---|---|---|---|
| Female employees (%) | 19.8 | 20.1 | 20.5 |
| Female managers (%) | 3.5 | 3.6 | 4.7 |
| New female employees (%) | 29.3 | 24.0 | 32.1 |
| Employees with disabilities (%) | 2.2 | 2.3 | 1.9 |
Annual paid days off / childcare leave
| 2023 | 2024 | 2025 | ||
|---|---|---|---|---|
| Average number of annual paid days off taken (days) | 13.0 | 14.5 | 13.6 | |
| Number of working mothers *5 | 80 | 85 | 78 | |
| Number of employees taking maternity leave | 18 | 17 | 10 | |
| Number of employees using the childcare leave system | Total | 28 | 39 | 29 |
| Male | 3 | 7 | 11 | |
| Female | 25 | 32 | 18 | |
| Number of employees using the shorter working hours system | 60 | 66 | 67 | |
| Return to work rate after childcare and related leave (%) | 80 | 100 | 95 | |
| Retention rate after returning from childcare and related leave (%) | 94 | 100 | 96 | |
*5 Mothers with children of elementary school age or below.
Education
| 2023 | 2024 | 2025 | |
|---|---|---|---|
| Training expenses (yen/person) | 130,111 | 63,163 | 65,010 |
| Training participation (%) | 92.5 | 58.7 | 55.0 |
Health *6
| 2023 | 2024 | 2025 | |
|---|---|---|---|
| Office staff - Overtime hours (hours/month) | 24.8 | 23.9 | 23.0 |
| Port staff - Overtime hours (hours/month) | 15.2 | 18.2 | 20.8 |
| Employees receiving regular health checkups *6 | 100 | 100 | 100 |
| Employees who smoke (%) *6 | - | 24.1 | 22.6 |
| Stress check participation (%) *6 | 85.0 | 58.6 | 93.1 |
*6 These figures were calculated using the method designated for the Survey on Health and Productivity Management implemented by the Ministry of Economy, Trade and Industry.
*7 Period covered by the survey: April to March of the previous fiscal year.